Plik:Prime number theorem ratio convergence.svg
Przejdź do nawigacji
Przejdź do wyszukiwania

Wielkość pliku podglądu PNG dla pliku SVG: 250 × 160 pikseli Inne rozdzielczości: 320 × 205 pikseli | 640 × 410 pikseli | 1024 × 655 pikseli | 1280 × 819 pikseli | 2560 × 1638 pikseli.
Rozmiar pierwotny (Plik SVG, nominalnie 250 × 160 pikseli, rozmiar pliku: 87 KB)
Opis
| Opis |
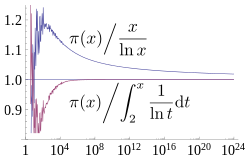
English: A plot showing how two estimates described by the prime number theorem, and converge asymptotically towards , the number of primes less than x. The x axis is and is logarithmic (labelled in evenly spaced powers of 10), going up to 1024, the largest for which is currently known. The former estimate converges extremely slowly, while the latter has visually converged on this plot by 108. Source used to generate this chart is shown below. |
| Data | |
| Źródło | Praca własna |
| Autor | Dcoetzee |
| SVG rozwój |


Licencja
Ja, właściciel praw autorskich do tego dzieła, udostępniam je na poniższej licencji
| Ten plik udostępniony jest na licencji Creative Commons CC0 1.0 Uniwersalna Licencja Domeny Publicznej. | |
| Osoby, które współpracowały przy tworzeniu tego utworu przeniosły go do domeny publicznej poprzez zrezygnowanie ze wszystkich przysługujących im praw na obszarze całego świata z tytułu prawa autorskiego oraz wszystkich powiązanych i podobnych praw, w zakresie dopuszczalnym przez prawo. Możesz kopiować, zmieniać, rozprowadzać i wykonywać to dzieło, nawet wykorzystując do celów komercyjnych bez pytania o pozwolenie.
|
Source
All source released under CC0 waiver.
Mathematica source to generate graph (which was then saved as SVG from Mathematica):
(* Sample both functions at 600 logarithmically spaced points between \
1 and 2^40 *)
base = N[E^(24 Log[10]/600)];
ratios = Table[{Round[base^x],
    N[PrimePi[Round[base^x]]/(base^x/(x*Log[base]))]}, {x, 1,
    Floor[40/Log[2, base]]}];
ratiosli =
  Table[{Round[base^x],
    N[PrimePi[
       Round[base^x]]/(LogIntegral[base^x] - LogIntegral[2])]}, {x,
    Ceiling[Log[base, 2]], Floor[40/Log[2, base]]}];
(* Supplement with larger known PrimePi values that are too large for \
Mathematica to compute *)
LargePiPrime = {{10^13, 346065536839}, {10^14, 3204941750802}, {10^15,
     29844570422669}, {10^16, 279238341033925}, {10^17,
    2623557157654233}, {10^18, 24739954287740860}, {10^19,
    234057667276344607}, {10^20, 2220819602560918840}, {10^21,
    21127269486018731928}, {10^22, 201467286689315906290}, {10^23,
    1925320391606803968923}, {10^24, 18435599767349200867866}};
ratios2 =
  Join[ratios,
   Map[{#[[1]], N[#[[2]]]/(#[[1]]/(Log[#[[1]]]))} &, LargePiPrime]];
ratiosli2 =
  Join[ratiosli,
   Map[{#[[1]], N[#[[2]]]/(LogIntegral[#[[1]]] - LogIntegral[2])} &,
    LargePiPrime]];
(* Plot with log x axis, together with the horizontal line y=1 *)
Show[LogLinearPlot[1, {x, 1, 10^24}, PlotRange -> {0.8, 1.25}],
 ListLogLinearPlot[{ratios2, ratiosli2}, Joined -> True],
 LabelStyle -> FontSize -> 14]
LaTeX source for labels:
$$ \left.{\pi(x)}\middle/{\frac{x}{\ln x}}\right. $$
$$ \left.{\pi(x)}\middle/{\int_2^x \frac{1}{\ln t} \mathrm{d}t}\right. $$
These were converted to SVG with [1] and then the graph was embedded into the resulting document in Inkscape. Axis fonts were also converted to Liberation Serif in Inkscape.
Historia pliku
Kliknij na datę/czas, aby zobaczyć, jak plik wyglądał w tym czasie.
| Data i czas | Miniatura | Wymiary | Użytkownik | Opis | |
|---|---|---|---|---|---|
| aktualny | 14:07, 21 mar 2013 | | 250 × 160 (87 KB) | wikimediacommons>Dcoetzee | Change n to x to match article |
Lokalne wykorzystanie pliku
Poniższa strona korzysta z tego pliku: